What is your Color IQ?
This topic is locked from further discussion.
23, I thought I did better than that.
Edit: Wait, its the lower the better. So thats pretty good. :D
3 on a pretty crappy monitor.

70, unfortunately towards the end I think I lost my ability to see color and I still cant :(.lucky326
Thats how I began to feel towards the end.
69. How perfect.cool_baller
age?
Got bored after 30 seconds...got an 891! woot! lol...EndGame2009
Umm....
It says the lower you get the better...
I got 66.
[QUOTE="cool_baller"]69. How perfect.marklarmer
age?
18. Why?Your score: 7
Nice. :D
27
i think i could have done better if i wasn't on a laptop. my crt monitor on my pc would have been much better. or even on my hdtv using the internet on my ps3.
12cametall
same


I got 0, that was kinda fun :P . Nice find TC.
[spoiler] 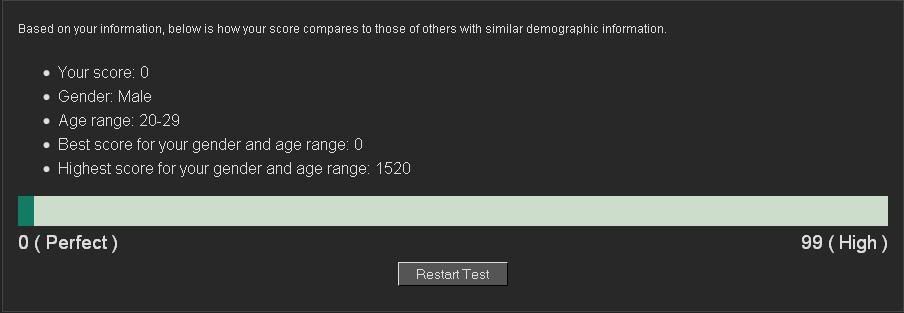 [/spoiler]
I got a 20, which doesn't seem too bad considering that I could see certain areas where I was wrong, but just couldn't be bothered to fix them.
Basically I was just sort of breezing through the test so I could hit the "submit" button.
Anyway, I did better than I thought I would, considering that I'm not really good with colors.
Still, the results page kind of sucks. The way the results work anyway is kind of annoying, how the lower your score is, the better you did. They also could have done with a bell curve sampling of results. Because really, when I go to the comparison page and it tells me that the best score for my age group was 0 and the worst score for my age group was 1500...well, that doesn't tell me very much. How about a graph showing where MOST people fall, that way I can actually compare myself with other people. I still have no idea if I did better or worse than average.
A graph or an average would have been nice, I agree. At least we can compare ourselfes with a few dozen people posting in this thread.I got a 20, which doesn't seem too bad considering that I could see certain areas where I was wrong, but just couldn't be bothered to fix them.
Basically I was just sort of breezing through the test so I could hit the "submit" button.
Anyway, I did better than I thought I would, considering that I'm not really good with colors.
Still, the results page kind of sucks. The way the results work anyway is kind of annoying, how the lower your score is, the better you did. They also could have done with a bell curve sampling of results. Because really, when I go to the comparison page and it tells me that the best score for my age group was 0 and the worst score for my age group was 1500...well, that doesn't tell me very much. How about a graph showing where MOST people fall, that way I can actually compare myself with other people. I still have no idea if I did better or worse than average.
MrGeezer


Please Log In to post.
Log in to comment