How To Benchmark Your New PC for Free

GameSpot may receive revenue from affiliate and advertising partnerships for sharing this content and from purchases through links.
Do you skip straight to the benchmarks when reading a review about a fancy new graphics card or the latest processor from AMD or Intel? You’re not alone--it’s common practice to get right to the numbers, and that’s because they provide a no-nonsense overview of how a particular component or setup performs. If you want to know which graphics card is faster, a GeForce GTX 1060 or a Radeon RX 480, you look at the gaming benchmarks and see which one comes out on top most often.
Benchmarks are an invaluable part of the review process, but they’re not just for professionals. Anyone with a PC can benefit from running a few benchmarks. Whether you cobbled your system together from scratch or bought a pre-built machine, it’s wise to benchmark your PC right off the bat. This helps you create a performance-metrics baseline to compare with, and you can reference those numbers when you install new drivers, upgrade a piece of hardware, or overclock your system.
You can also refer to those figures to root out potential problems with your PC--such as an ailing hard drive or a graphics card that suddenly seems sluggish--and to identify bottlenecks. Benchmarks provide concrete data to determine if a component is on the fritz or the area of your system that might benefit the most from an upgrade.
There’s a cost involved with running benchmarks--namely your time and how much storage a particular program takes up--but not necessarily a monetary one. Sure, you can shell out money for professional-grade benchmarks and unlock special features, but it’s also entirely possible to benchmark every aspect of your PC for free. To help you do that, we’ve compiled a list of no-cost benchmarks with descriptions of what they do. Let’s have a look!
Author: Paul Lilly
Prime95
Several years ago, we might’ve included Super Pi on this list. It was, at one time, an incredibly popular benchmark and stress-testing tool, especially among overclockers, since it could root out unstable overclocks rather quickly. Alas, Super Pi hasn’t been updated in two years. Furthermore, it’s a single-threaded application living in a multicore world, so we’ve moved on.
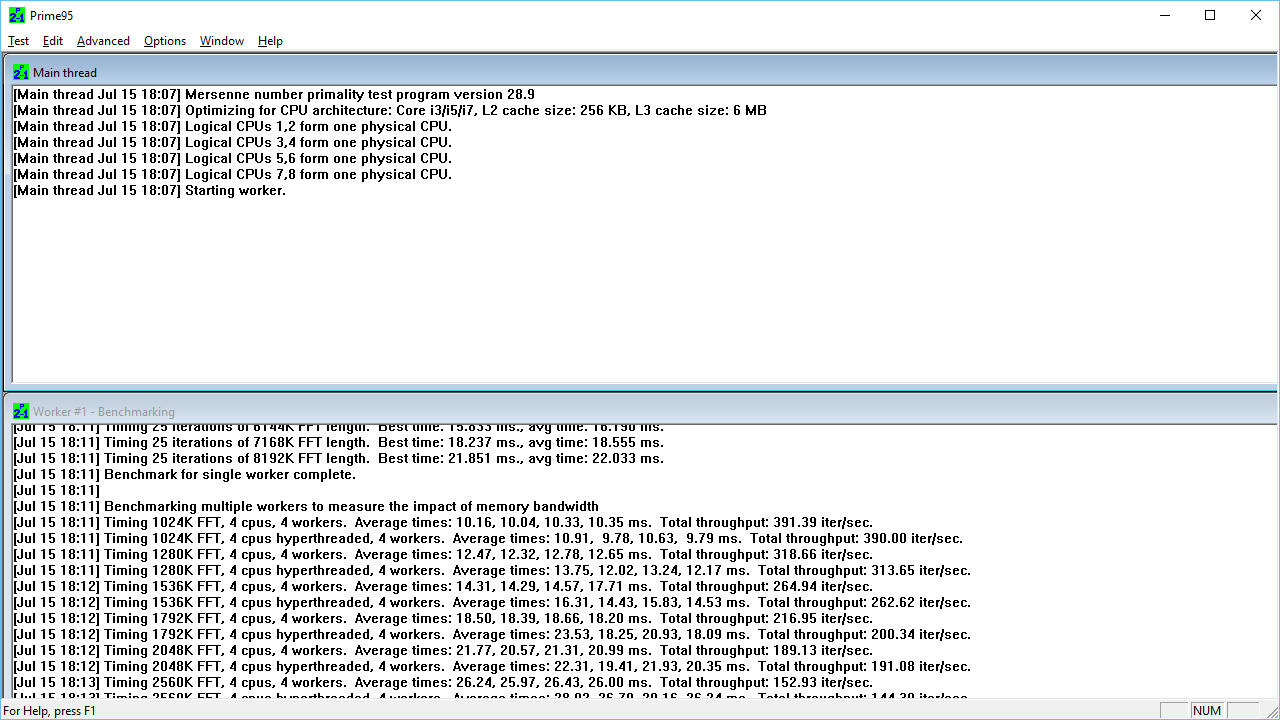
Several Pi-based benchmarks are still out there, however. One that’s stood the test of time of is Prime95, and many use it as a rigorous stress test to see if their overclocked system is stable. While somewhat less popular, Prime95 also has a built-in benchmark that will put your CPU through its paces, testing all physical cores and threads. After you load Prime95, you can find the benchmark in the Options menu.
Depending on your CPU, it will take several minutes to complete a full benchmark run. When it’s finished, the results will appear in the Prime95 window and will also be saved to a results.txt file located where Prime95 was installed or run from. To see how your processor stacks up to other CPUs, you can compare your results with others who’ve run the benchmark by heading to www.mersenne.org/report_benchmarks.
POV-Ray 3.7
Persistence of Vision Raytracer, more popularly known as POV-Ray, is a free, open-source multiplatform ray-tracing program used to produce high-quality 3D graphics. The latest release (version 3.7) adds support for symmetric multiprocessing and scales well with multicore processors. It also supports modern amenities like high-dynamic-range imaging.
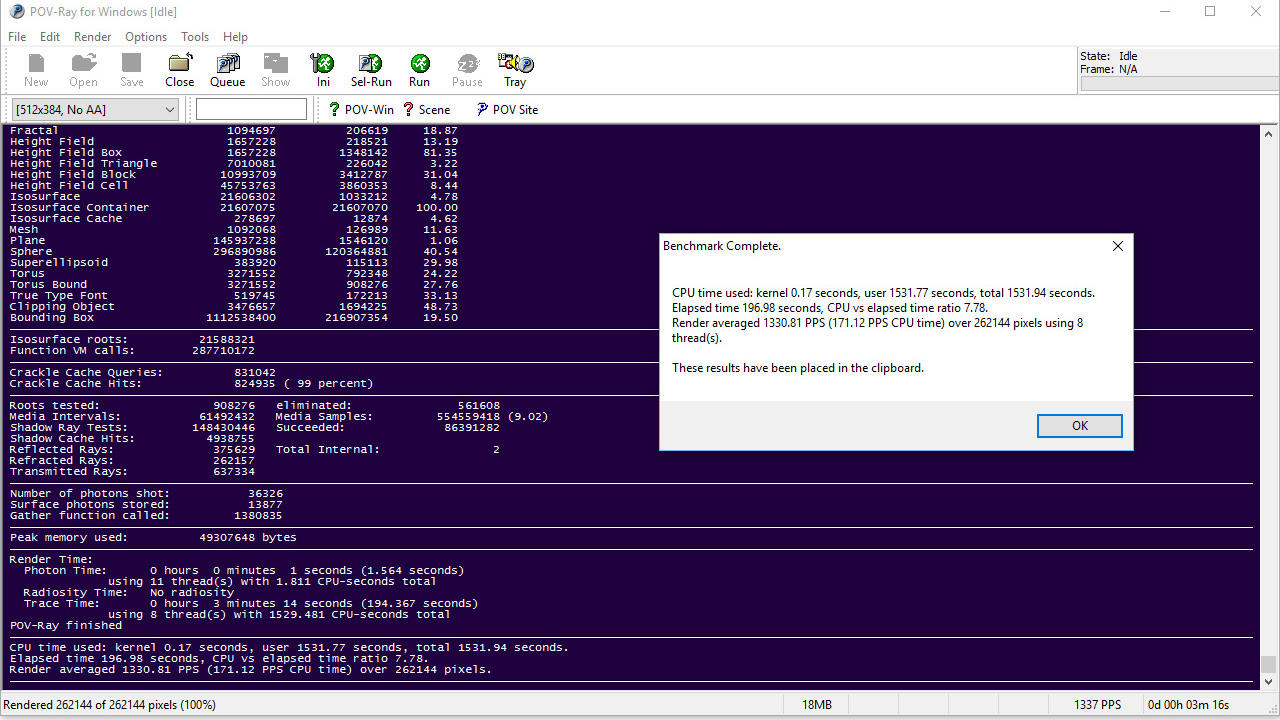
While you might think a program designed for creating 3D graphics would task the GPU, POV-Ray’s built-in benchmark actually hones in on your system’s processor. The more cores you have to throw at it, the better the result--a ten-core CPU is likely to perform better than a quad-core CPU, as you can see in our review of Intel’s Core i7-6950X processor.
POV-Ray isn’t visually exciting, but it’s easy to run. Just select “Run Benchmark (All CPUs)” from the Render menu or “Run Benchmark (One CPU)” if you want to gauge your processor’s single-core performance. When it’s finished, a pop-up window will tell you how many seconds it took to complete (lower is better) along with how pixels per second (higher is better) the render averaged.
x264 HD Benchmark
One of the quickest ways to make your processor break a sweat is through video encoding. Generally speaking, faster clockspeeds and higher core counts are the two most important factors, and Tech ARP’s brutal x264 benchmark utilizes both with aplomb, as you can verify by looking at the Resource Monitor in Task Manager when running it.
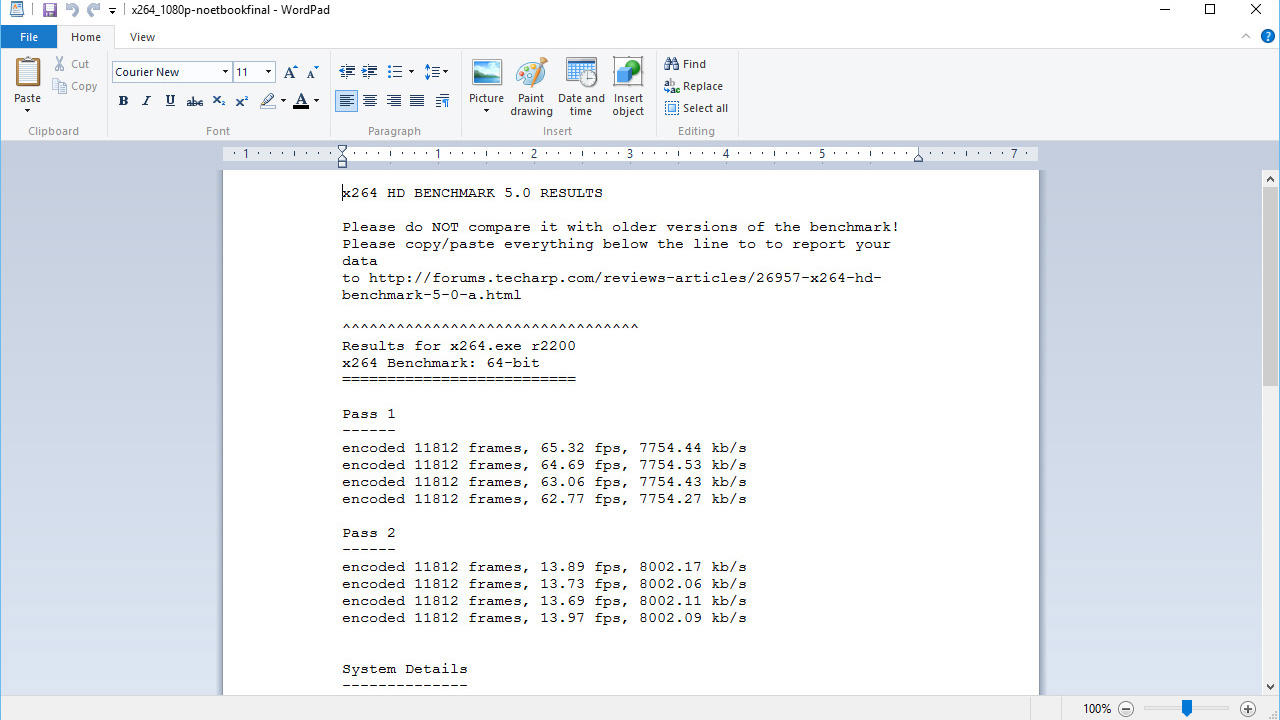
The x264 HD benchmark encodes a Full HD 1080p video file and converts it into a high-quality x264 video file. Depending upon the speed of your processor, you may want to time this one for when you plan to step away from your PC for a while, since it runs two passes four times each. It can take a good half hour or longer, even on modern processors.
As points of reference, a Core i7-6700K processor should average around 95 frames per second during the first pass and about 20fps during the second pass, while Intel’s flagship Core i7-6950X should get around 160fps and 38fps, based on our testing.
SiSoftware Sandra Lite
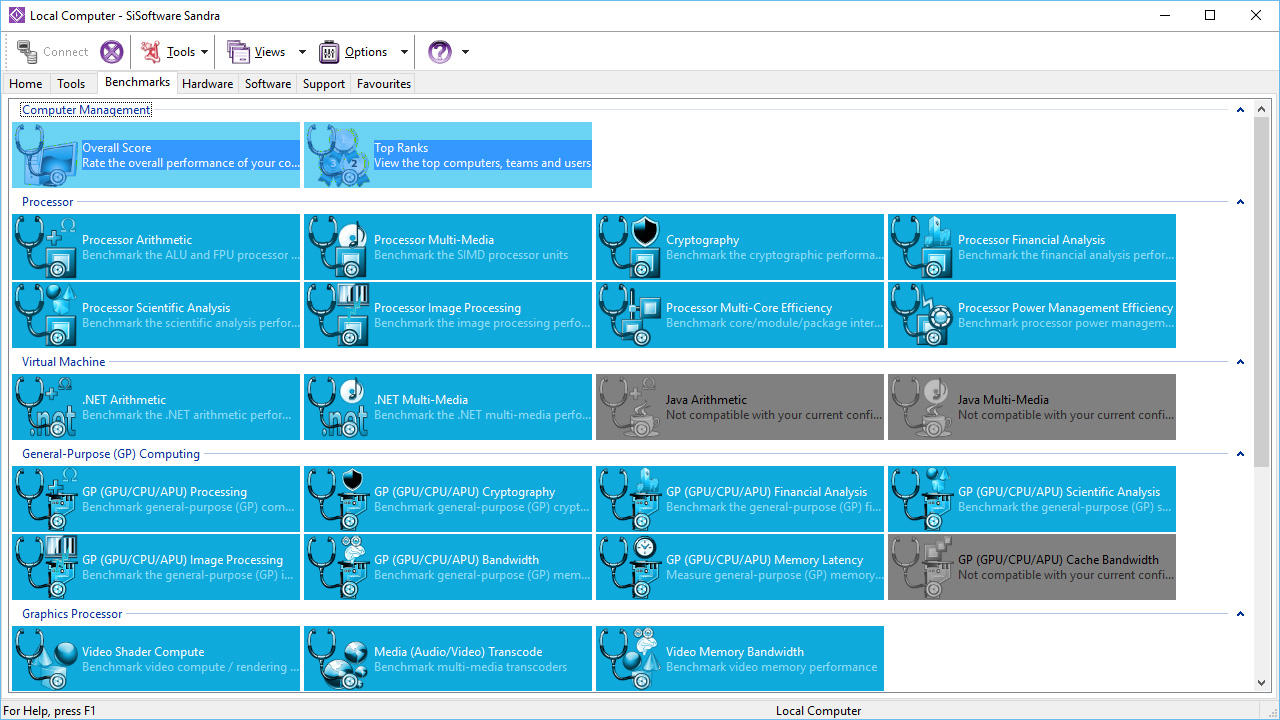
One of the more informative benchmarks out there is SiSoftware Sandra. This utility can provide a comprehensive audit of your system, including fine-grain details like RAM timings, the maximum bandwidth of various buses and interfaces, details about your power-management scheme, temps, and a whole lot more. If there’s something you want to know about your PC, chances are you’ll find it in Sandra.
The free Lite version includes a host of benchmarks broken down by category, such as Processor, Storage, and Memory, to name just a few. Each category contains multiple benchmarks. If you’re evaluating your CPU, you can test its multimedia performance, how good it is at scientific analysis, its multicore efficiency, and several other aspects. After you’ve run a benchmark, Sandra spits out a score, along with several points of reference--those being scores of other components.
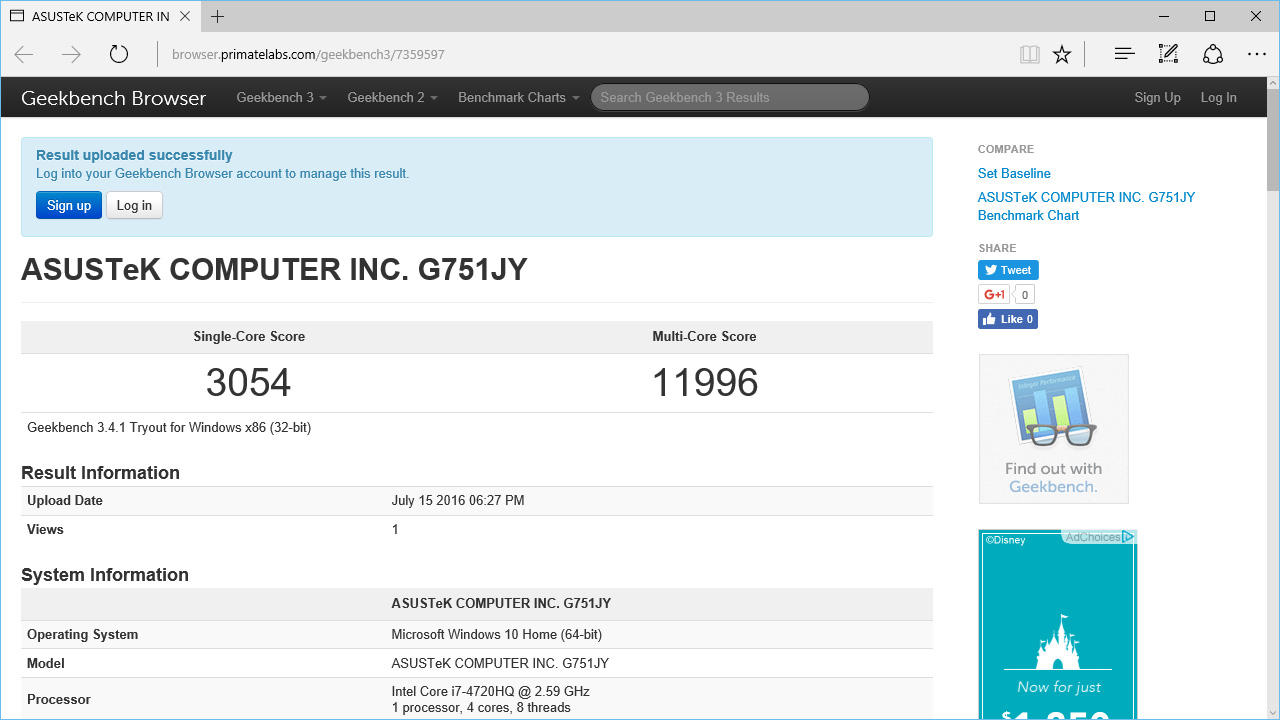
Geekbench 3
If you read a lot of mobile product reviews, you’ve probably run across Geekbench from Primate Labs. It’s a popular tool for testing smartphones and tablets, but it’s available for Windows, Mac, and Linux PCs, too. You’ll need an Internet connection to use Geekbench for free in Tryout Mode, and your test results are automatically uploaded to Primate Labs in exchange for using the benchmark at no cost (Tryout Mode lasts indefinitely).
The other limitation is that all 64-bit benchmarks are unavailable without a license. That’s a bit of a buzzkill, since we’re largely living in a 64-bit world these days, but Geekbench’s redeeming factor is that it’s a cross-platform benchmark for apples-to-oranges comparisons. If you’re wondering how your low-cost laptop stacks up against your high-end smartphone, Geekbench will tell you.
Geekbench is also pretty good about tapping into your processor’s multiple cores and threads. When it’s finished running, it generates two scores--one for single-core performance and a second multicore score. These are based on a plethora of tests that gauge integer, memory, and floating-point performance.
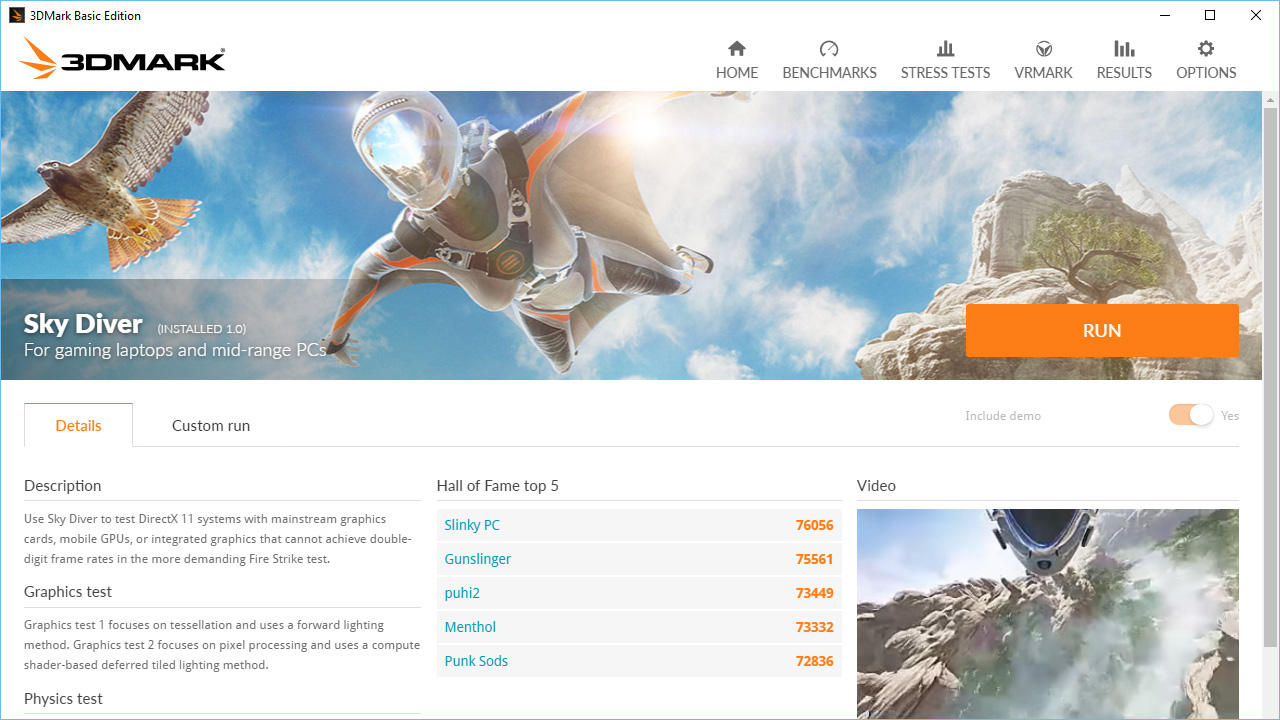
3DMark Basic Edition
There are two main ways to test your GPU’s gaming prowess. One is through synthetic testing, and the other is with real-world gaming benchmarks. Futuremark’s 3DMark falls into the former category and is the most widely used. It’s also one of the oldest 3D graphics testing tools--the first version was released way back in 1998, the same year Google was founded.
The latest version of 3DMark is the first one to enable cross-platform performance comparisons, allowing you to contrast scores from Windows, Windows RT, Android, and iOS devices. It also deviates from prior versions by separating its benchmark tests into different categories instead of taking a one-size-fits-all approach. If you’re running a gaming laptop, Cloud Gate and Sky Diver are your go-to tests, while more burly setups will want to run Fire Strike. There’s also a new Time Spy benchmark specifically designed to test DirectX 12 performance, provided you’re running Windows 10 and have a compatible GPU.
Each benchmark comes with a demo, and there’s no way to skip it in the free version. 3DMark also prevents freeloaders from making changes to specific testing parameters, but most people leave the default setting alone anyway, so it’s really no big deal.
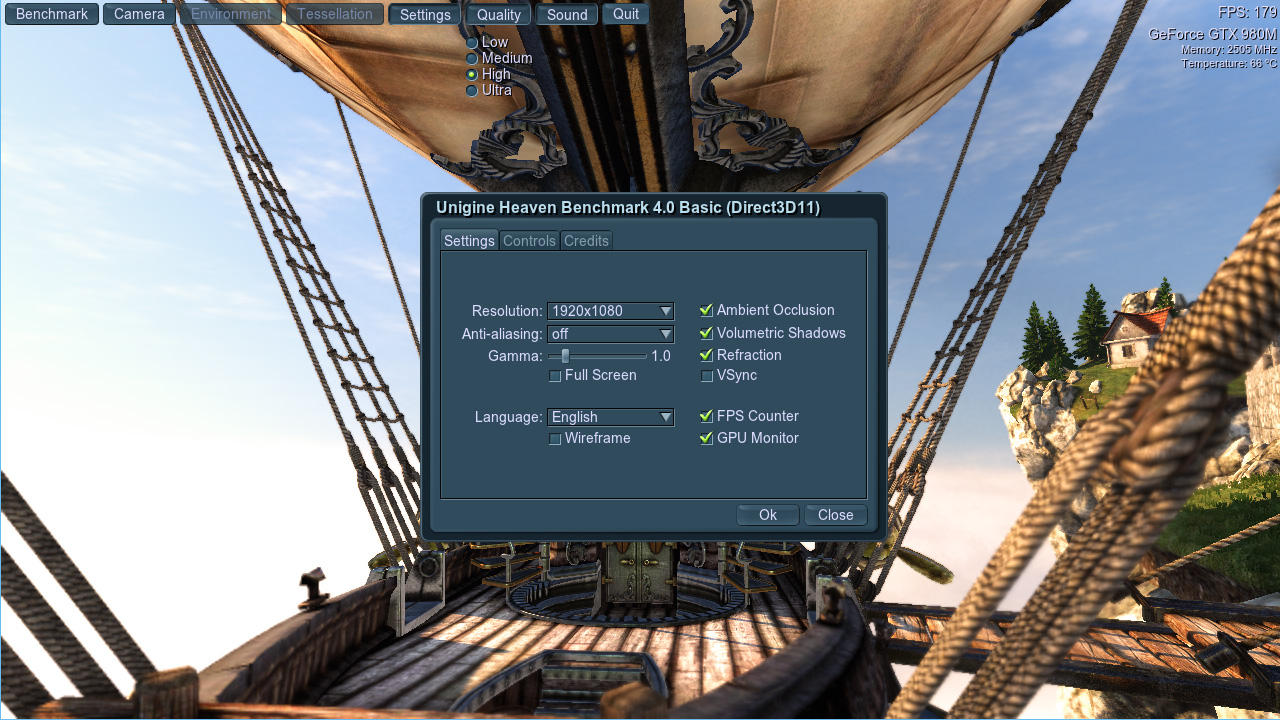
Unigine Heaven
Another benchmark that doubles as a stress-testing tool is Unigine’s Heaven 4.0. It only targets your GPU, and unlike some free utilities, all of the configurable graphics settings are unlocked. What do you get by springing for the Advanced or Pro editions? Benchmark looping, command-line automation support, reports in CSV format, and a few other odds and ends that don’t really affect how the benchmark runs.
You can choose between three different graphics APIs: Open GL 4.0, DirectX 9, and DirectX 11. Heaven also supports a variety of preset display resolutions, or you can enter a custom resolution if you’re running something funky and can’t find it in the pull-down menu. It also boasts support for multi-monitor setups.
What about Unigine’s Valley benchmark? Valley released after Heaven, but it never advanced past version 1.0. The latest iteration of Heaven is the newer of the two--and the more useful one for evaluating today’s graphics cards and GPUs. When it’s finished running, Heaven will generate an overall score, as well as tell you the average, minimum, and maximum framerates your GPU hit.
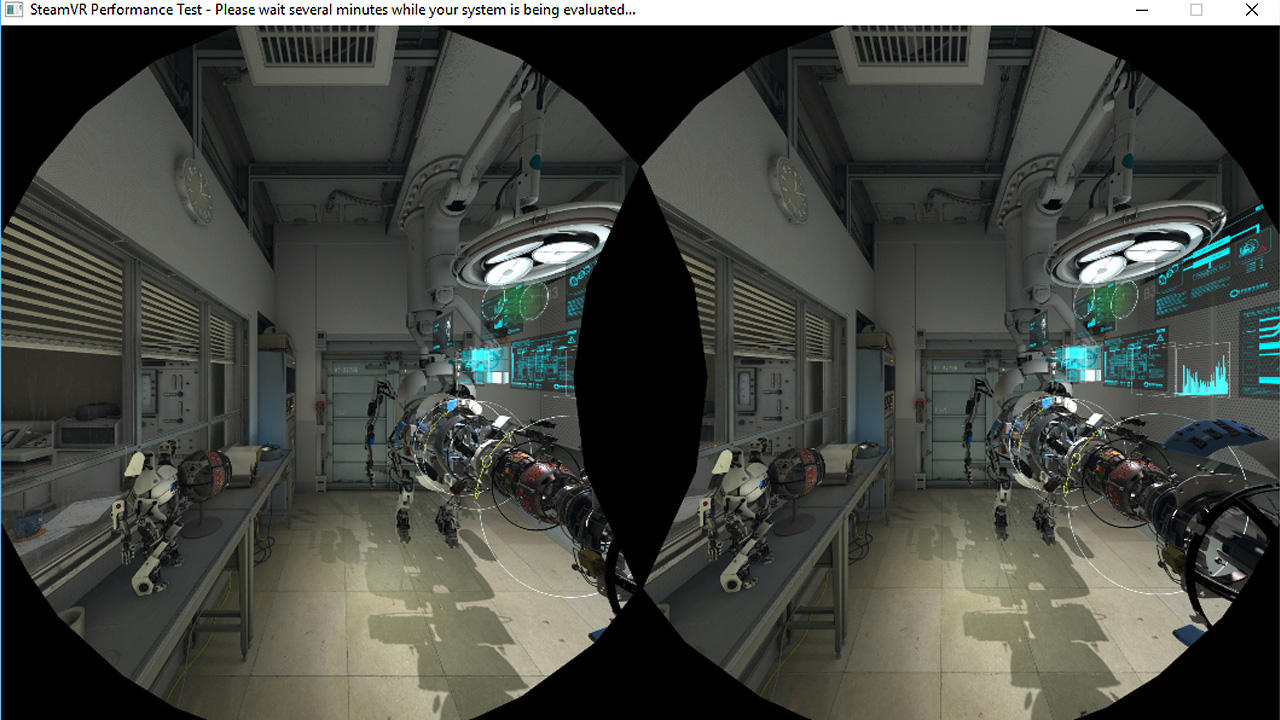
SteamVR Performance Test
Every so often, a technology comes along that has the potential to transform the industry. Right now, it’s virtual reality, along with its siblings augmented reality and mixed reality. If you need proof of this, take a stroll outside and try to go more than 10 feet without bumping into someone playing Pokemon Go, an augmented-reality title for smartphones.
While AR is taking over the mobile world in the form of Pokemon Go, game developers on the PC side are focusing on VR content for headsets like the Oculus Rift and HTC Vive. One thing they have in common is that both must be tethered to a reasonably powerful PC. Wondering if your system’s up to snuff? Valve’s SteamVR performance test will tell you.
SteamVR lets you know if your PC is VR ready, and if not, whether you’d benefit from a CPU or GPU upgrade (or both). Just be ready for sobering news, especially if you’re rocking a gaming laptop. We tested a previous-generation Asus ROG G751JY with an Intel Core i7-4720HQ processor, GeForce GTX 980M graphics, and 24GB of DDR3-1600 RAM--and barely missed the cut. SteamVR determined our laptop fell just a smidge short of being VR ready, noting that it’s “capable of rendering medium-quality VR but does not meet the recommended specs.” It also advised upgrading our graphics card, which obviously isn’t something most people will be in a position to do.
On the flip side, if your system fails to earn a passing grade because it doesn't meet the minimum hardware requirements, take a closer look at the actual benchmarking results to see if there's enough horsepower to play VR titles. In our case, SteamVR noted that our laptop averaged high-quality graphics with no instances of frames dipping below 90 frames per second. While it technically didn’t pass, it could probably handle most VR titles based on those metrics.
PCMark 8
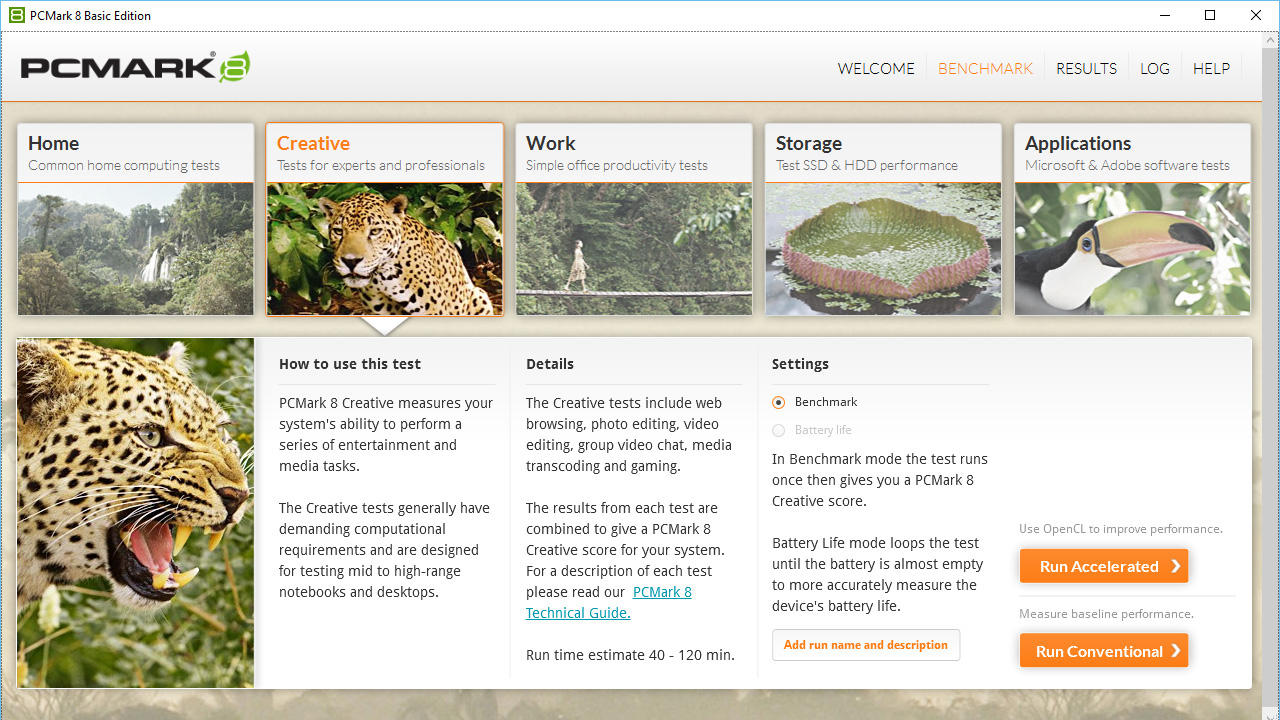
You may have some individually strong components in your PC, but how does it perform as a whole? That’s a question PCMark 8 will help answer. Unlike 3DMark, which mainly looks at your rig’s graphics card, PCMark 8 evaluates your entire setup and tests it with a variety of workloads broken down into several categories.
In the free version, you can run the Home, Creative, and Work tests. The Home test measures your system’s ability to perform general-purpose computing chores and isn’t all that intensive, while the Creative preset runs your system through a series of entertainment and media tasks. And, like it sounds, the Work tests focus on productivity chores, such as browsing the Web, video chat, spreadsheets, and so forth.
You can run each of the tests as they are in Conventional mode or choose the Accelerated option to use OpenCL for better performance. Either way, you’ll want to carve out a chunk of time if you plan to run all three tests, which can collectively take more than an hour to complete, depending on your setup.
CrystalDiskMark
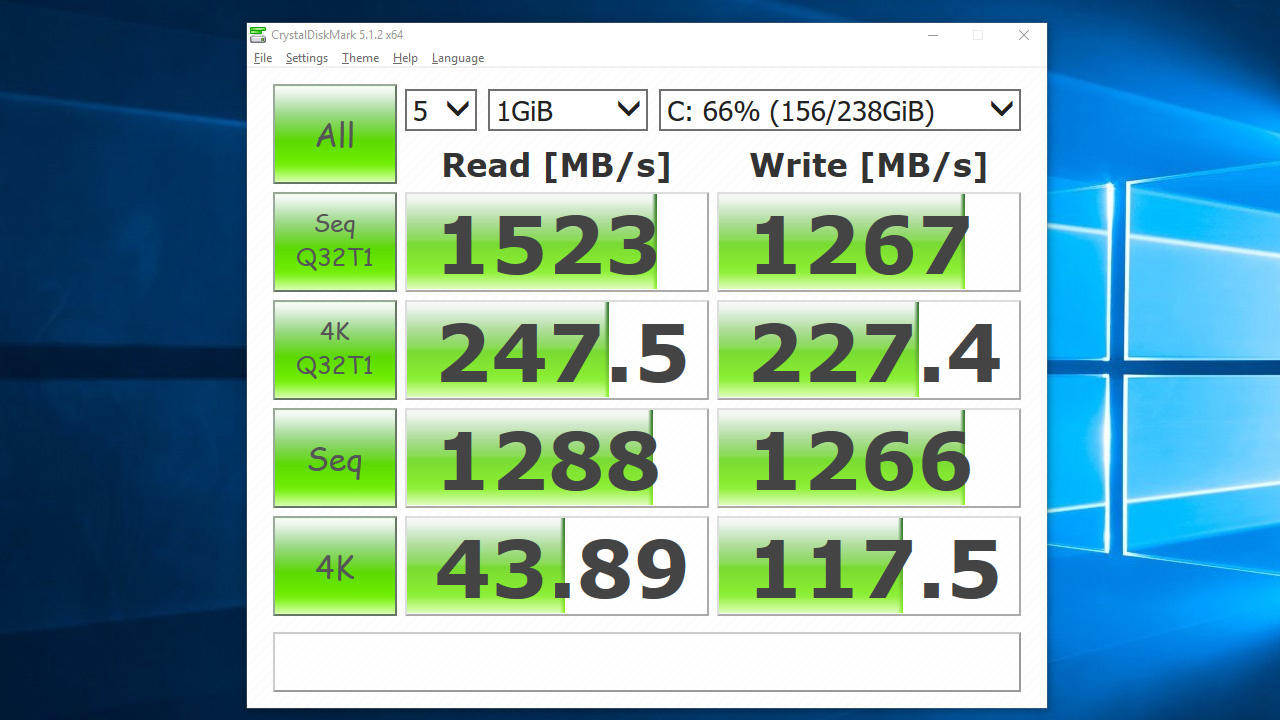
It can be tricky finding a capable benchmark for your storage scheme--not all of them will test write performance on a drive that’s not empty. CrystalDiskMark doesn’t suffer any such limitations. Not only does it evaluate your drive’s write performance, but it also breaks the results down into multiple categories, including sequential read and writes and random read and writes at various queue depths.
Another bonus to using CrystalDiskMark? The ability to test different file sizes. The default value is 1GB, but you can change this to 50MB, 100MB, 500MB, 2GB, 4GB, 8GB, 16GB, and 32GB. This will give you an idea of how well your drive handles both big and small file sizes, and everything in between.
It’s best to run CrystalDiskMark on NAND flash storage, such as a solid state drive or USB thumb drive. You can benchmark a mechanical hard drive using CrystalDiskMark, but it typically takes longer to run--around 10 to 15 minutes to complete all four tests on older, slower HDDs, versus around 4 minutes (or less) on SSDs.
http://crystalmark.info/software/CrystalDiskMark/index-e.html
ATTO
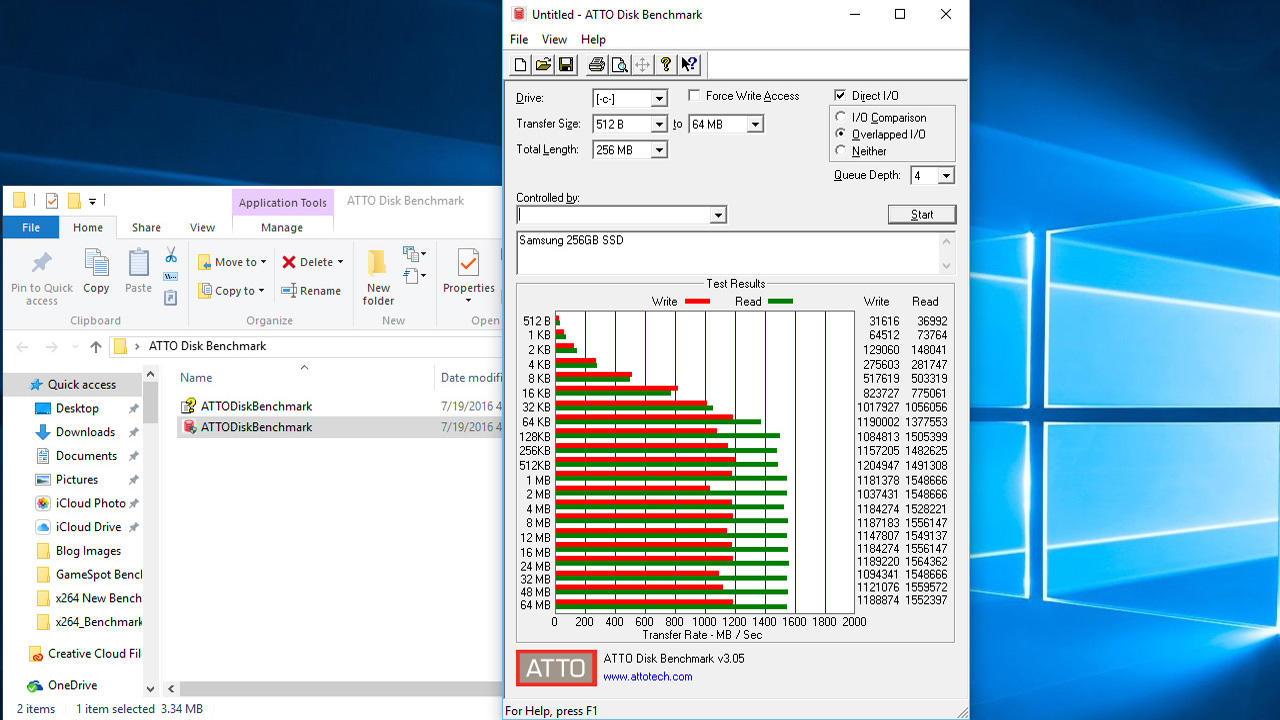
If you want a second opinion to CrystalDiskMark or need to benchmark a hard disk drive in a shorter amount of time, ATTO will provide meaningful results that are easy to digest. It benchmarks both read and write performance, even on drives that aren’t empty, starting with 512-byte transfers and working its way up to 64MB files. It supports a variety of queue depths as well.
ATTO is an older benchmark with a dated UI, but it’s extremely easy to use and still relevant. All you need to do is select the letter of the drive you want to benchmark and press Start. For the most accurate results, make sure you’re not doing anything on your PC as ATTO runs. That’s true of most benchmarks, but especially here, since even menial tasks like surfing the Web or navigating Windows can engage your primary storage drive.
SpeedTest
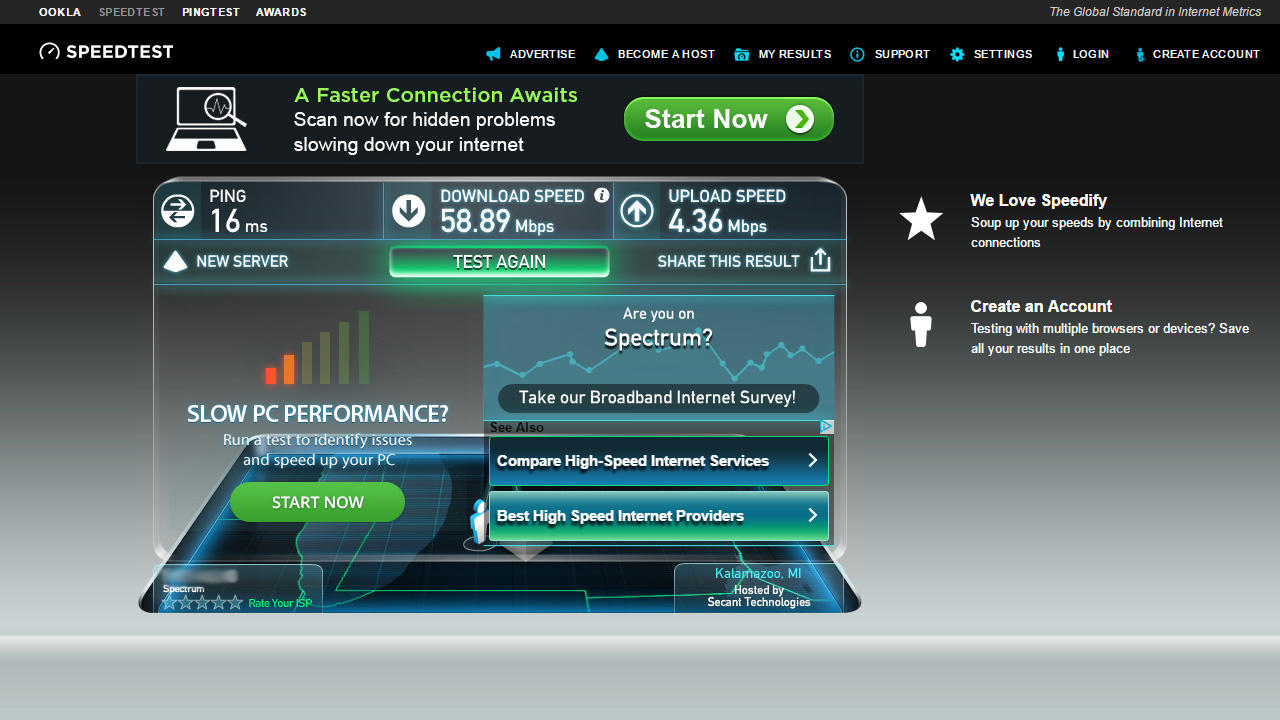
One of the oft-looked aspects of benchmarking is a system’s network performance. Are you getting the kinds of advertised speeds that you pay your ISP for? Is your new Wi-Fi card working correctly? SpeedTest will help you answer those and similar questions by testing your setup’s broadband performance, including download speed, upload speed, and your ping.
A variety of factors can influence this test. One of the biggest is your wireless connection. If you’re running this test from a wireless setup, expect to see your download and upload performance drop and your ping rise the farther away you are from the router. Barriers, such as thick walls and doors that sit between your system and the router, also impact wireless performance--especially if you’re connected to your router’s 5GHz band.
Another thing that can affect SpeedTest’s results? The number of PCs and gadgets actively using your Internet connection. If little Billy is upstairs fragging his friends in Overwatch while his sister Suzie watches Netflix in the next room over, SpeedTest will have to compete with both of them for bandwidth, along with any other Internet-connected devices in your home.
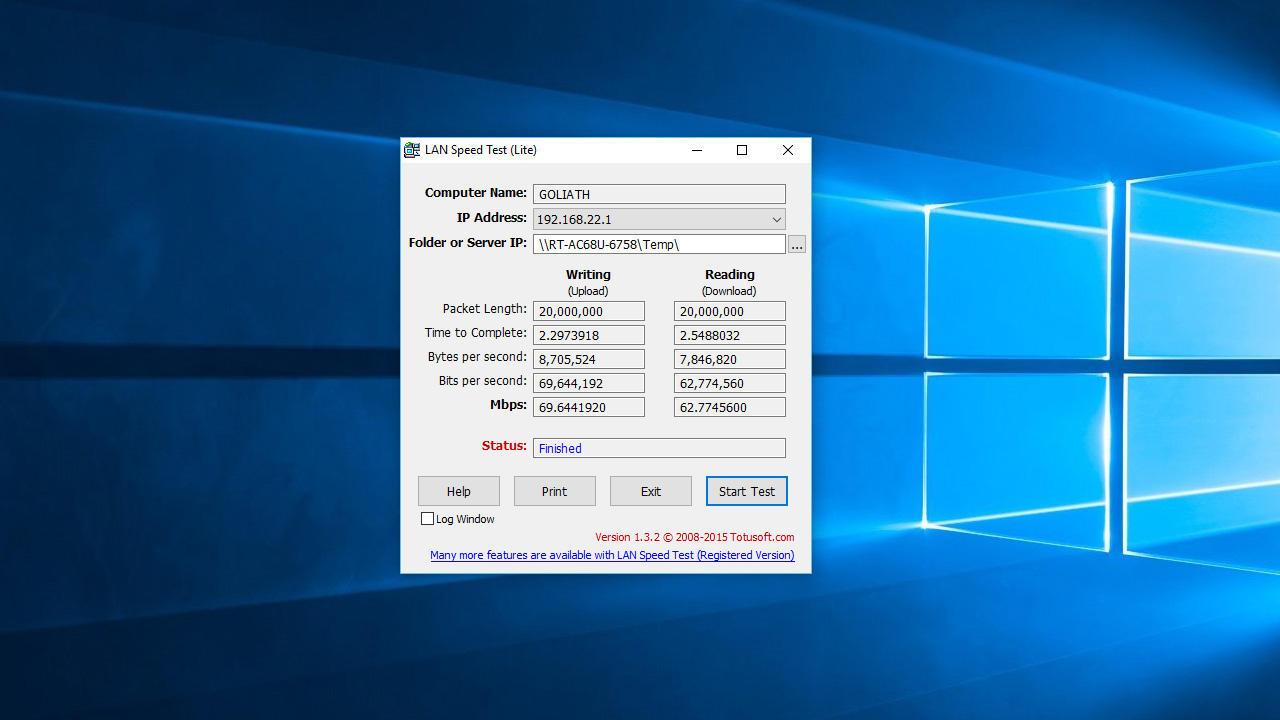
LAN Speed Test Lite
The aptly named LAN Speed Test is a lightweight utility that does exactly what it says. It doesn’t require any installation or complicated configuration--just load it up, select a shared folder on your home network, and click Start Test. Usually within seconds, it will finish and report results based on the time it took to read (download) and write (upload) a file.
You can change the file size to give your LAN more of a workout, but even testing multiple-gigabyte files doesn’t take very long. And once LAN Speed Test is finished running, it politely deletes the file it created, so there’s no cleanup involved.
LAN Speed Test Lite is a couple of generations old at this point, and it lacks a few features of the paid version, such as being able to choose to have results displayed in gigabytes or megabytes per second instead of megabits. However, the free version gets the job done.